
Our Shake Table users are familiar with the earthquake scaling file called q_scale. This file has been around a long time, but it has been refined over the years. Special thanks to Dr. Eduardo Jausel from the Massachusetts Institute of Technology for his suggestions on the 'baseline' method and revised the source code.

So what does q_scale do exactly? Given an earthquake acceleration record, q_scale
computes the position that the shake table must track in order to obtain the
same accelerations - while keeping it below the maximum position specified. This
enables an earthquake to be replayed on a bench top shake table and still
obtain the same accelerations as recorded.
Take the Northridge
earthquake for example. As with many other tremors, the recorded
acceleration record can be downloaded from the PEER Ground
Motion Database. At a certain measurement station, the peak acceleration
and displacement of Northridge reached 0.60 g and 16.9 cm. The trajectory
recorded at that station is shown in the two left-hand plots in the figure below
under 'Recorded Acceleration' and 'Recorded Position'.
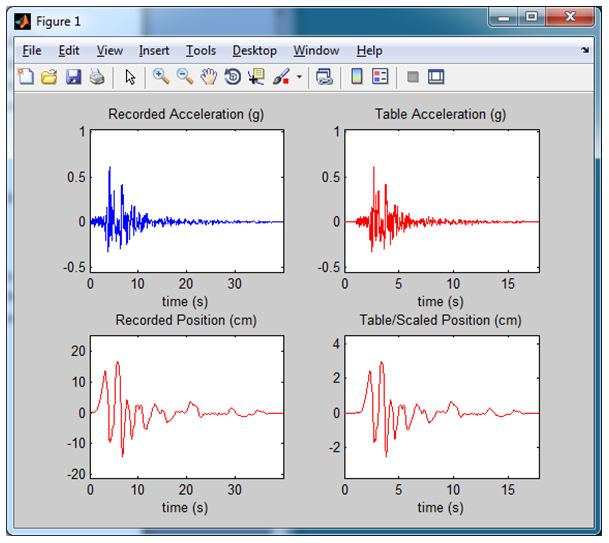
When processed by q_scale, the acceleration
amplitude is maintained (notice the peak acceleration is kept at 0.60 g) and the
displacement is scaled-down to 3 cm (i.e. the specified maximum position). The
position and acceleration records from q_scale
are shown on the right-hand side in the above figure under the Table
Acceleration and Table/Scaled
Position plots. Notice that in order to keep the same acceleration, the
duration of the tremor is shrunk down from 40.0 sec down to 16.8 sec.
Using ground motions from actual
earthquakes makes the lab more interesting. Motivation is key and students
would rather see their building stand up to the Northridge earthquake then a pre-defined
sinusoidal.
- Mitch Levis, Manager, Curriculum
No comments:
Post a Comment